What Are AI Hallucinations and How Do You Reduce Them?
AI hallucinations explained - why ChatGPT, Claude and Gemini make things up, the common types, a real-world example, and practical ways to reduce them at work.
Insights and guides to help you master data, BI, and analytics.
AI hallucinations explained - why ChatGPT, Claude and Gemini make things up, the common types, a real-world example, and practical ways to reduce them at work.
Classification vs regression explained with business examples - how to tell them apart, common algorithms, the right metrics, and the logistic regression trap.
SQL window functions explained with small examples - ROW_NUMBER vs RANK vs DENSE_RANK, LAG and LEAD, running totals, moving averages and top-N per group.
How large language models work, step by step - tokens, embeddings, transformers and attention, next-token prediction, training, and why they hallucinate.
KPI vs metric explained - leading vs lagging indicators, north star and vanity metrics, counter-metrics, and a checklist for choosing good KPIs.
P-values explained in plain English with a coin-flip example - what a p-value measures, what it doesn't, why 0.05 isn't magic, and how to report honestly.
RAG vs fine-tuning vs prompt engineering compared - what each changes, cost and effort, a decision guide with business examples, and why teams combine them.
Data warehouse vs data lake vs lakehouse compared - structure, cost, users and tools, how open table formats created the lakehouse, and which fits your team.
Precision vs recall explained with a fraud-detection example - the confusion matrix, F1 score, the threshold trade-off, and which metric to prioritize when.
A beginner pandas tutorial built around the 15 operations analysts use daily - loading, filtering, grouping, merging, pivoting and dates - with short examples.
What is MCP? The Model Context Protocol explained for data teams - hosts, clients and servers, tools and resources, a warehouse example, and the security risks.
A/B testing explained step by step - hypothesis, sample size, significance and confidence intervals, with a worked checkout example and common mistakes.
ETL vs ELT explained - how each works, why cloud warehouses made ELT the default, when ETL still wins, and the tools used at every step of a modern pipeline.
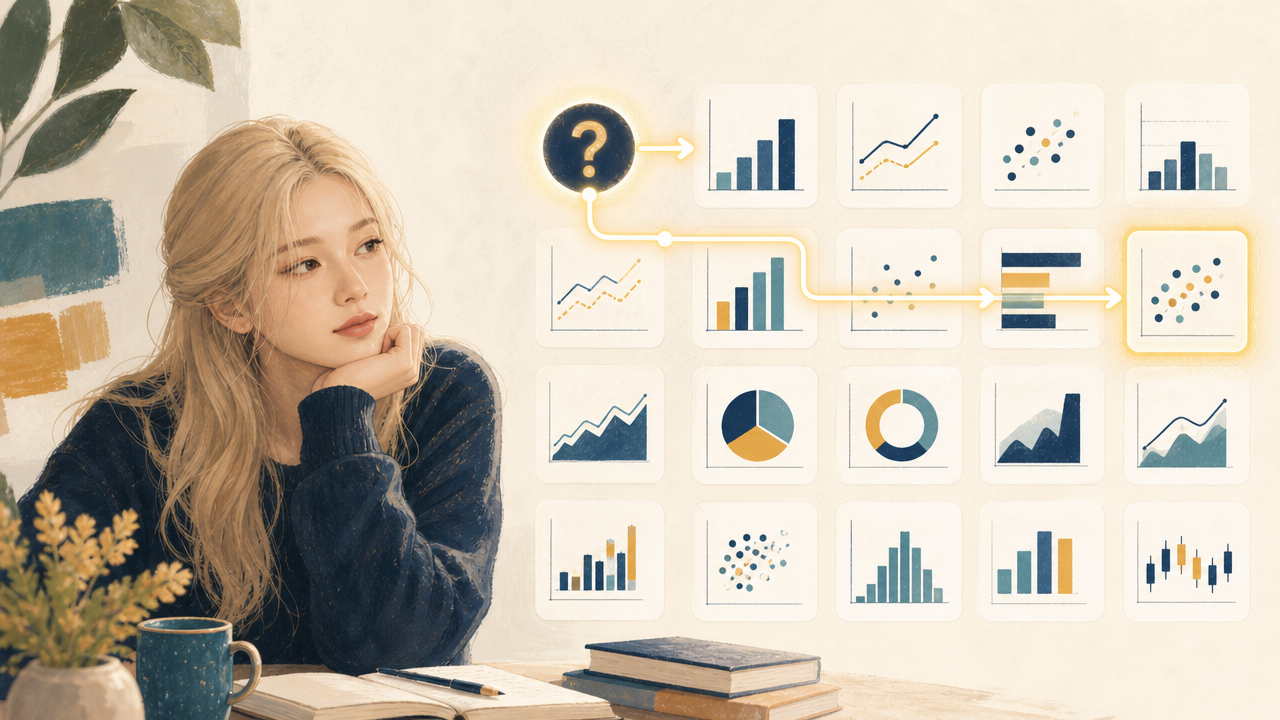
How to choose the right chart type - match your question (comparison, trend, part-to-whole, distribution, relationship) to the chart that answers it best.
Overfitting vs underfitting explained with a decision-tree example - how to read train vs test scores, the bias-variance trade-off, and practical fixes.
Mean vs median vs mode explained with a salary example - how skew and outliers distort the average, when to use each, and what to report in business dashboards.
Embeddings and vector databases explained simply - how text becomes numbers, how cosine similarity finds meaning, and why they power RAG and semantic search.
A 12-step data cleaning checklist for real-world data - duplicates, missing values, messy categories, dates, outliers and keys, with pandas code.
Star schema vs snowflake schema explained with a retail example - fact and dimension tables, grain, trade-offs, and why Power BI works best with a star.
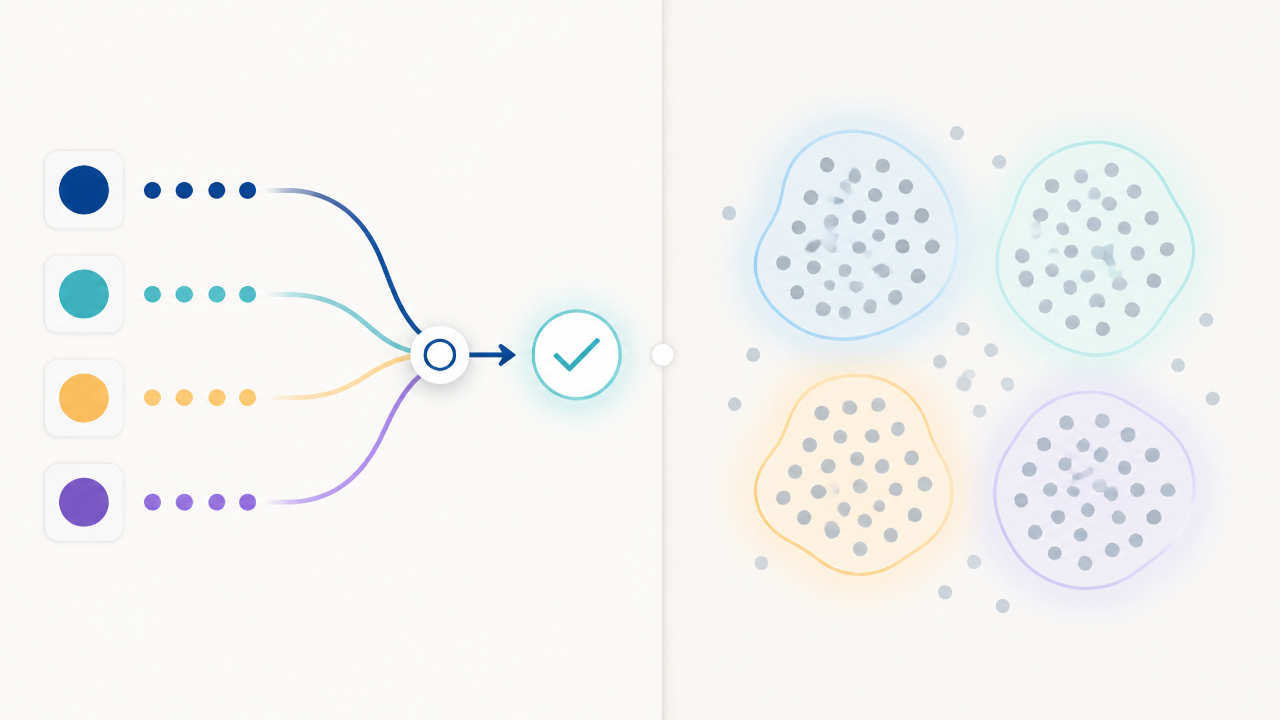
Supervised vs unsupervised learning explained with one telecom example - labels, algorithms, evaluation, and where reinforcement learning fits.
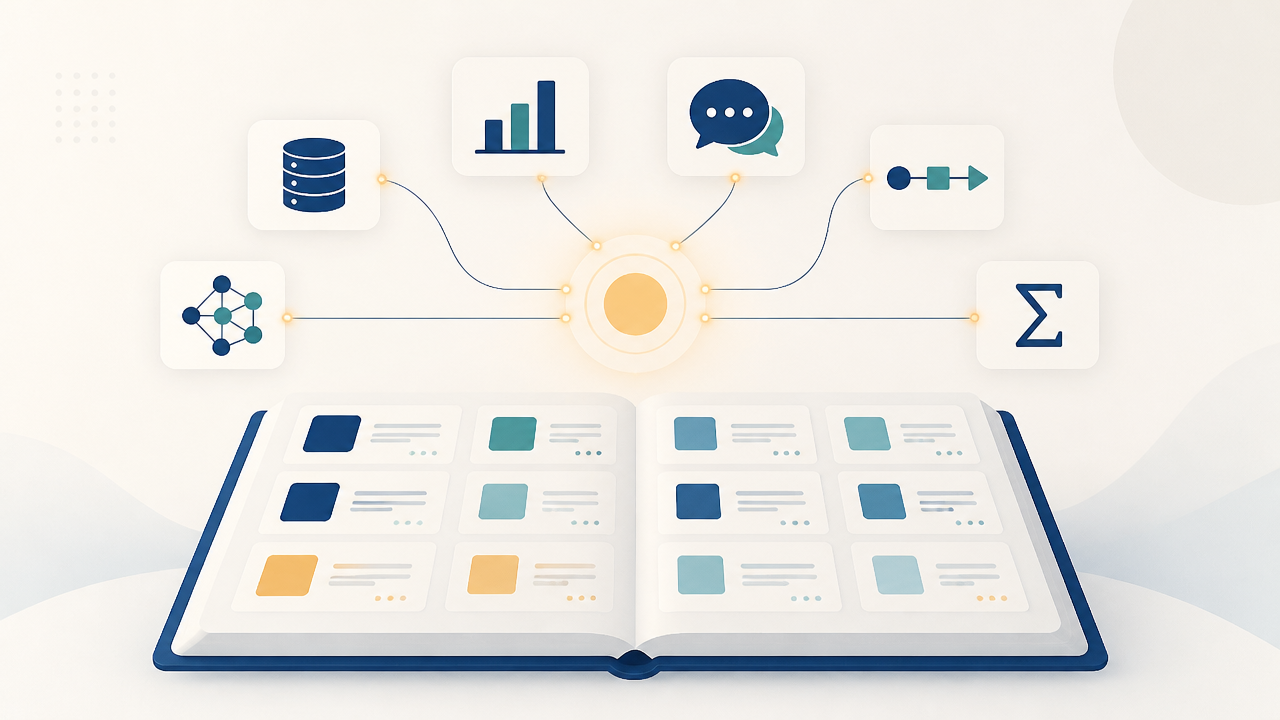
A plain-English glossary of data science, analytics and AI terms - from A/B testing and DAX to RAG, tokens and window functions - with links to full guides.
What tokens, context windows and temperature mean in ChatGPT, Claude and Gemini - how they affect cost, accuracy and output, with a worked cost example.
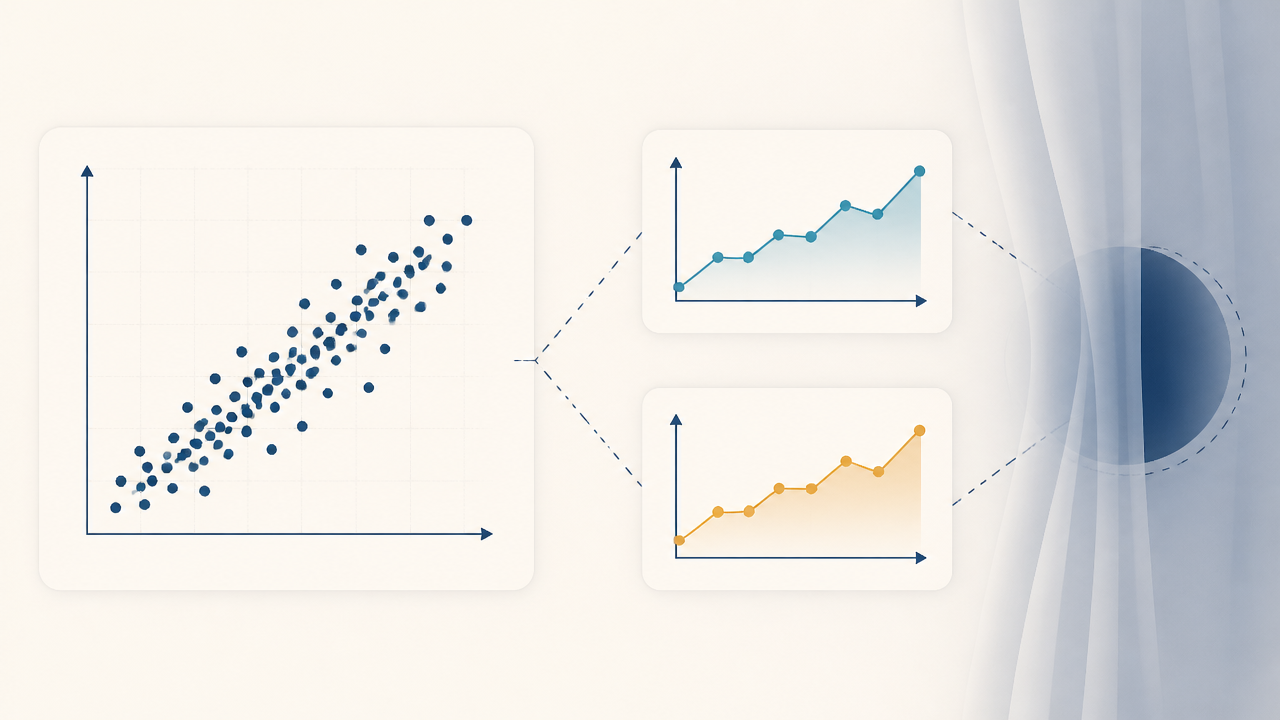
Correlation vs causation explained with business examples - confounders, reverse causality, selection bias and Simpson's paradox, and how to test for causation.
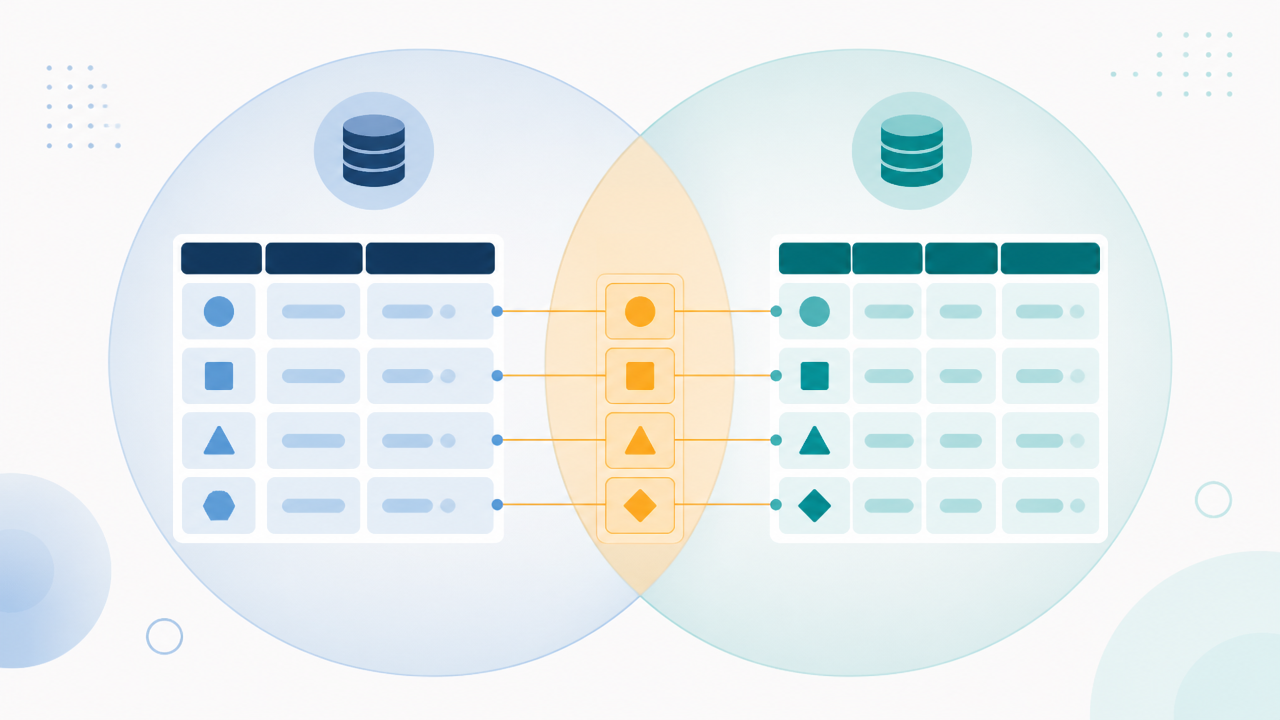
SQL joins explained with one small dataset - INNER, LEFT, RIGHT, FULL and anti-joins, plus the WHERE-clause trap and duplicate-row mistakes analysts make.
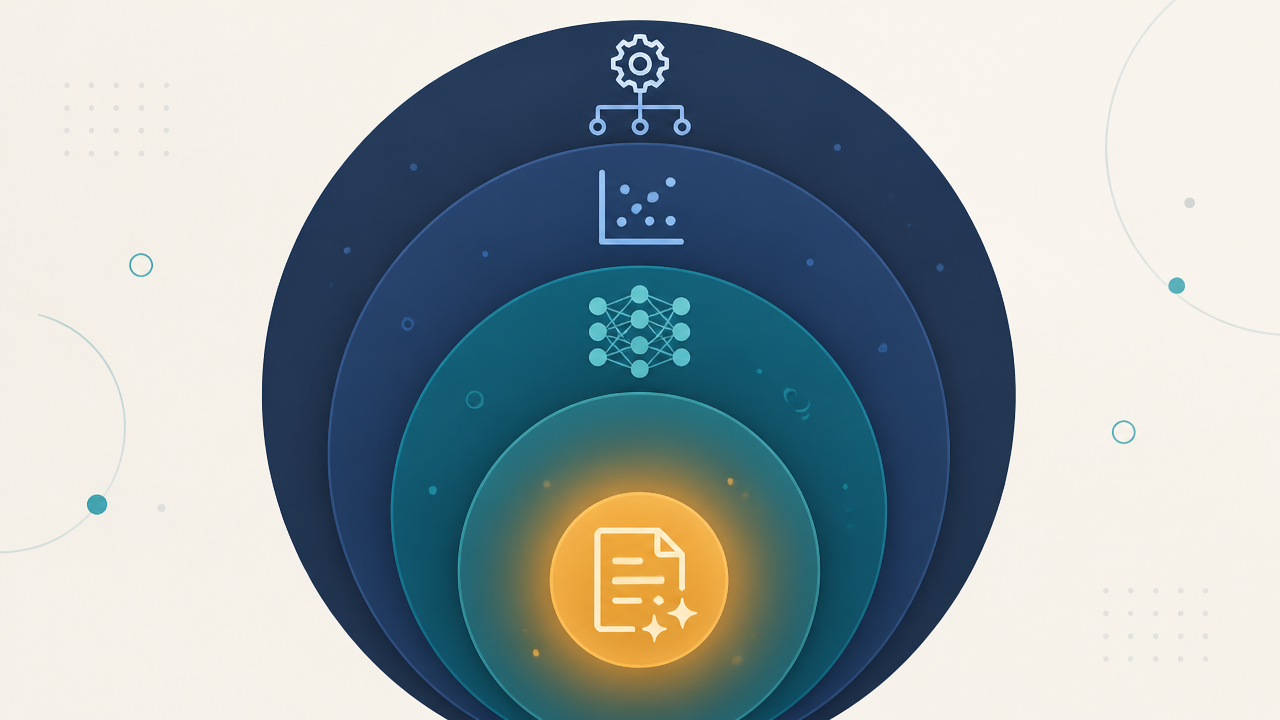
AI, machine learning, deep learning and generative AI explained as nested layers, with one bank example per layer and what each means for your learning path.
Descriptive, diagnostic, predictive and prescriptive analytics explained with one worked example, plus the tools, skills and job roles behind each type.
What is DAX in Power BI? A plain-English guide to measures vs calculated columns, filter context, CALCULATE and time intelligence, with worked examples.
A free, downloadable Python cheat sheet for data analysts, covering the pandas functions and syntax basics you'll reuse on the job daily.
When Coursera, DataCamp and Udemy typically run their biggest sales, so you can time a subscription or course purchase around real discounts.
The best data science and analytics courses under $50, chosen for genuine teaching quality rather than simply being the cheapest option.